Cloud Cost Management: How to Optimize Cloud Cost in Multi-Cloud Environment

- Exploring cloud usage patterns helps identify hidden cost-saving opportunities.
- Highlighting automated policies can optimize resources and streamline workload management.
- Discovering cost allocation strategies enables effective tracking across multiple cloud providers.
Today, organizations are choosing multiple cloud vendors to tackle various problems in the business. Service in one cloud can outperform similar services in another cloud, which leads to a multi-cloud, multi-vendor, and multi-billing environment.
However, managing such an infrastructure might not be easy for businesses. Some of the common challenges companies face are:
- Consolidated view of spend across all cloud providers and vendors
- Locate the underutilized resources
- Forecast the spending on the billing cycle
- Lack of proper notification
- Slice and dice the data according to company-specific tags
To address all the challenges mentioned above, Anblicks has designed a tool called Cloud Cost Management (CCM) that can optimize cloud expenditure and help businesses develop a feasible multi-cloud environment.
The tool allows stakeholders to develop intuitive reports, manage resources, and provide a consolidated view across multiple vendors. The tool further helps the businesses to forecast the expenses and send alerts to the stakeholders.
The Architecture
Since we now understand what CCM is. Let’s have a look at its architecture and understand how the CCM application was built. To provide a better understanding, we have considered the most popular cloud vendors – Azure, AWS, Snowflake, and Databricks to begin.
Following is the architectural diagram of the CCM that shall provide a bigger picture of the application’s operations and functions. The entire application can be divided into sub-phases, and similar tasks can be grouped.
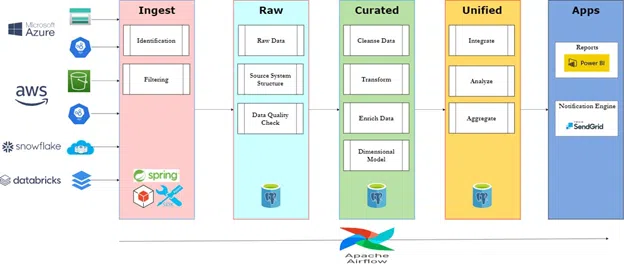
The overall design of the architecture is divided into 3 parts – consolidated data source, data warehouse, and data visualization.
- Data Discovery
The cost data hereafter called consumption data, and resource utilization data is the most vital part of the CCM. Each vendor shares the data differently, like Azure gives APIs and Daily Export to a Storage Account, while Snowflake provides it in a table in a shared database.
The data is refreshed and updated at specific intervals. Another challenging part we identified in the resource utilization is to get the memory information for each resource.
It involves several steps to follow to install packages that we made more straightforward by making it a 1-click script to make this information available.
- Data Ingestion and Extraction
The consumption and utilization of data are then extracted from external sources and copied to our dedicated Postgres Data Warehouse. Ensure to keep the data in the natural form to draw most of the information.As we all know, it is the most time-consuming process as a connection needs to be set up between external and internal sources, and a lot of data is transferred.We leveraged AWS SDK, Snowflake JDBC, and JAX-RS APIs to flood the data into our systems.
- Data Transformation
- Databricks is a PAAS that runs on Azure, so the cost is divided between the cloud and the vendor. Calculating the consumption data of Databricks is complicated.The cost billed by Azure is straightforward to get from an external source, but on the contrary, Databricks cost needs to be calculated from the data we receive from Azure. We went through a sophisticated process of using Azure Tags due to the absence of consumption data directly from Databricks.
- Snowflake is billed on the per-second basis of running warehouses. Any number of users can run the warehouse simultaneously, because of which Snowflake does not provide credits consumed on a per user basis. As part of the transformation, we joined several tables to calculate each user’s credits consumed.
- The Databricks and Snowflake run on the number of credits used and billed accordingly. We did mappings on credit to cost and calculated the final amount charged for each day.
- AWS and Azure Tag is one of the essential parts of the CCM as most organizations rely on it to manage their cloud operations. We followed a consistent approach between AWS and Azure to make a curated JSON Data that will power the Power BI Dashboard.
- Data Loading
Since we are working with data warehousing, Kimball’s dimensional modeling principles addresses most of the problems.We strictly followed these principles while we did a data model design; we figured out the perfect dimensions and segregated them from the facts.Another critical aspect is to filter out the records that do not contribute to these reports making sure we keep the highest quality of data in our systems.
- Data Integration
Data integration is a critical part of the CCM as it performs analytics to the data pulled from all the vendors. We have merged the consumption and utilization data to calculate the underutilized resources.
Based on a pre-configured threshold on the utilization percentage, we will calculate the savings by downgrading the resource type. Data across all the vendors were also unified to give a consolidated view of the expenditure report.
- Data Rendering
A sophisticated and robust data model can help Data Visualization tools bring the best out of the entire cloud. CCM is built on top of the free tier Twilio’s SendGrid and a low-cost Microsoft PowerBI platform.
However, this is decoupled with the backend. As a result, any mature data visualization tool can be used.
Twilio SendGrid Notification can be easily integrated into the Spring Boot application via APIs. Using the Free Tier account, 100 emails per day can be sent to the distribution list. Daily, Weekly, Monthly, Quarterly, and Yearly Summary reports can be sent directly to the inbox.
Power BI
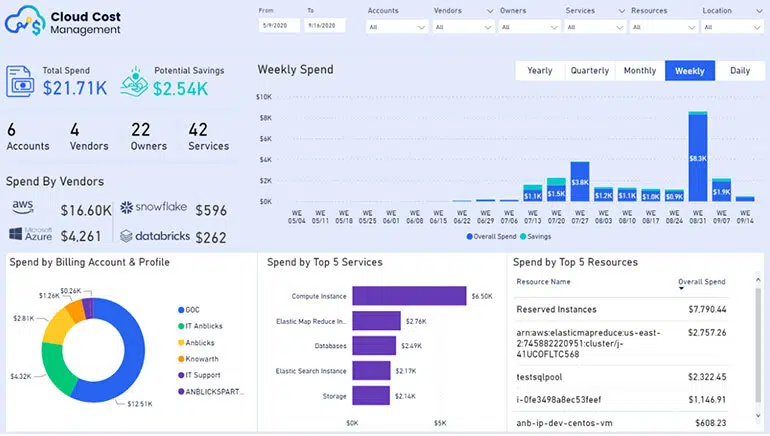
- PowerBI can connect to our data source and visualize the data in different types of charts. We have set up a connection to Postgres data warehouse and created other pages in our report separately for every vendor, i.e., AWS, Azure, Snowflake, and Databricks.
- A consolidated view of all the vendors with the consumption and utilization details like the spend by Account, Service, Resource, Location, User can give a quick insight across the entire infrastructure.
- A KPI for Potential savings on each page is added, representing the amount of spend that can be saved if we had used the resources effectively.
- Filters like Accounts, Services, Resources, Location, Time are arranged on every page to drill down to the lowest granularity to get useful insights.
- Cloud platforms like Azure and AWS provide the tags information, which helps users build custom reports with the custom fields. A general use can be Spend by Environment – Dev, SIT, UAT, Prod.
- The ad-hoc reporting is another feature of the dashboard where we can create our charts by merely entering the required fields as text in the text panel. However, it is possible only with a flexible backend data model and an NLP Algorithm.
- A persona-based reporting is an enterprise feature where the data will be shared with the users based on their assigned role. For example, a developer has the most restricted view, while a C level executive can see the entire company’s data.
Execution
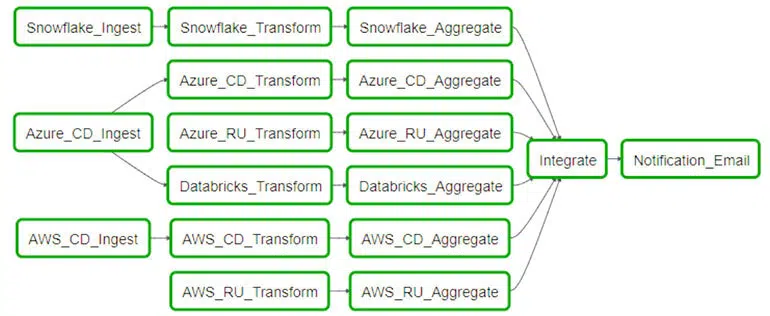
The application is orchestrated by Apache Airflow open-source workflow platform management. A Directed Acyclic Graph is built to break into tasks, which becomes a prerequisite for the other tasks.Once the entire data is loaded from sources, transformation is applied, integrations are done, and finally, the email is sent, and the data is refreshed in the dashboard.If one of the data sources failed to execute, it wouldn’t affect the hierarchy.
The data sources are decoupled from each other to avoid breakdown of the application.Also, CCM is made config driven by a React-based UI to add/remove accounts, add/remove notification email addresses, and a set cadence execution interval, which can be as low as 6 hours to once in a month.
CCM Accelerator
To manage the cloud costs, Anblicks developed CCM, a cloud cost management accelerator. With plenty of data insight available, we help our clients to reduce their cloud spend.
Please click here to know more about Anblicks CCM accelerator.

