TL;DR
- Emphasizing customer data, lead scoring assigns scores based on engagement and behavior.
- Highlighting lead potential, it enables sales teams to prioritize high-value prospects.
- Focusing on seamless integration, lead scoring works with CRM tools for efficient lead tracking
In our last blog Know Your Audience Craft A Customer Persona we discussed how Artificial Intelligence is helping marketing teams to target better and specifically explored how customer segmentation can help enterprises understand their audience. This post focuses on more granular aspects like how determining the quality of leads (prospective customers) is an essential part of any marketing process.
Marketing teams are often faced with a classic problem on the volume of prospects they receive every day. Traditional marketers often follow an intuitive way of choosing customer profiles and call them up one by one. This intuition is more of an experienced guess. Hiring more people can only guarantee a reach, not conversion. Marketers need a comprehensive and informed method of prioritizing multiple leads they receive every day. Lack of which often leads to manual filtering where you have to go through the contact list one by one and assign priorities after studying the profile to separate the wheat from the chaff.
Although achievable, it is likely that you’ve missed out on some sales opportunities by the time you’ve gone through that process. And we all know how time sensitive it is to reach out to the customer in time.
One way to do this is by having a data-driven lead scoring system.
With the advent of AI & Machine Learning, we now have a way of prioritizing leads based on
- Their past performance
- Demographics
- Psychographics
- Other influential factors like channel, type of customer, buying journey, customer wallet share and more
If the perceived value of the lead is clearly represented by an accurate score, you can do a better job of reaching out to prospects more valuable to you. You can prioritize calls that are more likely to lead to a sale, as opposed to dead ends. The ones that don’t meet your criteria can be left with your marketing department for further nurturing, improving your team’s operational efficiency with better targeted campaigns.

Machine Learning (ML) for Lead Scoring:
Now that we have established that a lead score is a much-needed solution for prioritizing customers, let us understand how machine learning determines this score for each customer/lead profile


Machine Learning Algorithms work under two major assumptions:
- There exists a pattern.
- You have data on it.
Most problems in the universe today are debated to assume some kind of pattern over time. But there are exceptions to this in the likes of Brownian motion and chaos theory.
Nevertheless – Patterns!
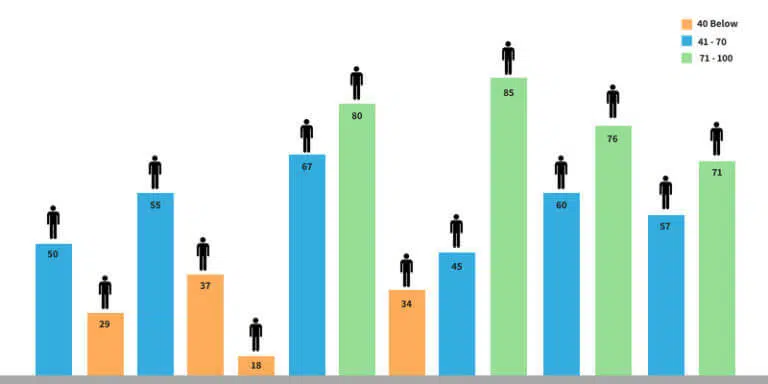
Technically, Lead Scoring is often treated as a classification problem.
The algorithm learns through the enormous data, detects hidden patterns and derives the propensity of conversion. This is the simplest way of scoring, but it just may not be enough depending on the use case. A lot of math goes into solving a problem and some amount of trial and error as well to set up the right parameters or to find the right optima (the best we could do) of the problem.
Each algorithm works in its own special mathematical way and it takes a lot of feature engineering and dimensionality reduction techniques to make it supremely efficient. Diving into their math is beyond this article, but we will see how logistic regression – one of the most powerful and explicable algorithms works to solve this problem.
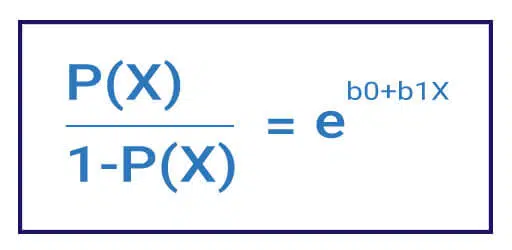
Logistic Regression was developed by statistician David Cox in 1958. It is used when a response variable is categorical in nature (i.e. student pass/fail or loan default/not default). The basic idea of this algorithm is to find a relationship between features and the probability of a particular outcome. Mathematically, we use the Logistic function to model this relationship and capture the range of probabilities.

Figure – 2 shows an equation we call the Logistic Equation – the core of logistic regression.
The quantity p(X)/[1-p(X)] is called the odds and takes on the values 0 to infinity. The odds values close to 0 and infinity indicate very low and very high probabilities of the outcome, respectively.
We also use a method called maximum likelihood (right side of the equation) to seek b0 and b1 values such that predicted probability corresponds as closely as possible to the individual’s observed state. In other words, we try to find b0 and b1 such that plugging these estimates into the model for p(X) yields a number close to one for all individuals who succeed and a number close to zero for all individuals who would fail.
Concepts of Log odds and maximum likelihood drive the logistic regression to establish a relationship between the features and give a probability of belonging to a class. Values close to one indicate that a particular profile is inclined toward becoming your customer.
Over time, the ML model becomes increasingly accurate as new information — every click, review, transaction, and interaction — is fed back to it. The result? You can help your team find the right customer at just the right time — not to mention that your business is operating more effectively.
The aforementioned approach is quite generic and may vary based on every use case. This is one of the challenges data scientists face daily – Every business problem has a very different solution based on various real-life factors.
Once your model has learned the patterns in your past data. It’s time to make some predictions and assign the propensities to newer profiles that come in.
In the real-time scenario, the predictions might go wrong for some leads. Make it a practice to provide feedback when the predictions go right or wrong. This feedback will help the model learn more and more patterns, thus adding value to your lead-scoring initiative and eventually improving over time.
Anblicks has helped many global enterprises integrate predictive marketing analytics to improve their lead quality by leveraging complex machine learning & data science techniques. If you have tons of customer profiles on your desk (or your database) but don’t know where to start? Feel free to reach out to us at sales@anblicks.com

Anblicks is a Data and AI company, specializing in data modernization and transformation, that helps organizations across industries make decisions better, faster, and at scale.


